Aviation Weather HandbookFAA-H-8083-28B
Chapter 12
Vertical Motion and Clouds
9 pagesPages 12-1–12-9
12.1 Introduction
A cloud is a visible aggregate of minute water droplets and/or ice particles in the atmosphere above the Earth’s surface. Fog differs from clouds only in that the base of fog is at the Earth’s surface while clouds are above the surface. Clouds are like signposts in the sky that provide information on air motion, stability, and moisture. Clouds help pilots visualize weather conditions and potential weather hazards. Clouds form in the atmosphere as a result of condensation of water vapor in rising currents of air, or by the evaporation of the lowest layer of fog. Rising currents of air are necessary for the formation of vertically deep clouds capable of producing precipitation heavier than light intensity.
12.2 Vertical Motion Effects on an Unsaturated Air Parcel
As a bubble or parcel of air ascends (rises), it moves into an area of lower pressure (pressure decreases with height). As this occurs, the parcel expands. This requires energy (or work), which takes heat away from the parcel, so the air cools as it rises (see Figure 12-1). This is called an adiabatic process. The term “adiabatic” means that no heat transfer occurs into, or out of, the parcel. Air has low thermal conductivity (see Table 5-3), so transfer of heat by conduction is negligibly small.
The rate at which the parcel cools as it is lifted is called the lapse rate. The lapse rate of a rising unsaturated parcel (air with relative humidity less than 100 percent) is approximately 3°C per 1,000 ft (9.8°C per km). This is called the dry adiabatic lapse rate. This means that for each 1,000-ft increase in elevation, the parcel’s temperature decreases by 3°C. Concurrently, the dewpoint decreases approximately 0.5°C per 1,000 ft (1.8°C per km). The parcel’s temperature-dewpoint spread decreases, while its relative humidity increases.
This process is reversible if the parcel remains unsaturated and, thus, does not lose any water vapor. A descending (subsiding) air parcel compresses as it moves into an area of higher pressure. The atmosphere surrounding the parcel does work on the parcel, and energy is added to the compressed parcel, which warms it. Thus, the temperature of a descending air parcel increases approximately 3°C per 1,000 ft (9.8°C per km). Concurrently, the dewpoint increases approximately 0.5°C per 1,000 ft (1.8°C per km). The parcel’s temperature-dewpoint spread increases, while its relative humidity decreases.
Figure 12-1. Unsaturated Ascending/Descending Air Parcel Example
12.3 Vertical Motion Effects on a Saturated Air Parcel
The Lifted Condensation Level (LCL) is the level at which a parcel of moist air lifted dry adiabatically becomes saturated. At this altitude, the temperature-dewpoint spread is zero and relative humidity is 100 percent.
Further lifting of the saturated parcel results in condensation, cloud formation, and latent heat release. Because the heat added during condensation offsets some of the cooling due to expansion, the parcel now cools at the moist adiabatic lapse rate, which varies between approximately 1.2°C per 1,000 ft (4°C per km) for very warm saturated parcels to 3°C per 1,000 ft (9.8°C per km) for very cold saturated parcels. Concurrently, the parcel’s dewpoint decreases at an identical rate. For simplicity, examples shown in this handbook use a moist adiabatic lapse rate of 2°C per 1,000 ft. Regardless of temperature, the relative humidity remains constant at about 100 percent.
As the saturated air parcel expands and cools, its water vapor content decreases (see Figure 12-2). This occurs because some of the water vapor is condensed to water droplets or deposited into ice crystals to form a cloud. This process is triggered by the presence of microscopic cloud condensation (and ice) nuclei, such as dust, clay, soot, sulfate, and sea salt particles. The cloud grows vertically deeper as the parcel continues to rise.
Figure 12-2. Ascending Air Parcel That Becomes Saturated Example
In Figure 12-2, at the surface the air parcel has a temperature of 18°C and a dewpoint of 13°C, indicating that it is unsaturated. As the parcel ascends, its temperature decreases at the dry adiabatic lapse rate of 3°C per 1,000 ft, while the dewpoint decreases at 0.5°C per 1,000 ft. The temperature-dewpoint spread decreases while relative humidity increases until the parcel achieves saturation at its LCL of 2,000 ft. As the parcel continues to ascend, condensation produces cloud formation. Because the heat added during condensation offsets some of the cooling due to expansion, the parcel now cools at the moist adiabatic lapse rate of 2°C per 1,000 ft. The parcel’s dewpoint decreases at an identical rate as the lost water vapor condenses to form the cloud. The relative humidity of the ascending saturated (i.e., cloudy) parcel remains constant at about 100 percent.
A descending saturated air parcel quickly becomes unsaturated (see Figure 12-3). Its temperature increases at 3°C per 1,000 ft, while its dewpoint increases at 0.5°C per 1,000 ft (see Table 12-1). The temperature-dewpoint spread increases while relative humidity decreases.
Figure 12-3. Descending Air Parcel Example
At 5,000 ft, both the temperature and dewpoint of the air parcel are 6°C, indicating that it is saturated. As the parcel descends, it quickly becomes unsaturated. Its temperature increases 3°C per 1,000 ft, while its dewpoint increases at 0.5°C per 1,000 ft. The temperature-dewpoint spread increases while relative humidity decreases until the parcel reaches the surface. Note that the parcel is now much warmer and drier at the surface than when it began the vertical motion process in Figure 12-2.
Table 12-1. Air Parcel Vertical Motion Characteristics
| Parcel | Unsaturated | Saturated | ||||
|---|---|---|---|---|---|---|
| Temperature Change | Dewpoint Change | Relative Humidity | Temperature Change | Dewpoint Change | Relative Humidity | |
| Ascending (rising) | -3°C/1,000 ft | -0.5°C/1,000 ft | Increases | -1.2°C to -3°C/1,000 ft | Identical to temperature change | 100% |
| Descending (subsiding) | +3°C/1,000 ft | +0.5°C/1,000 ft | Decreases | |||
12.4 Common Sources of Vertical Motion
There are many sources of vertical motion in the atmosphere. Four of the most common types of vertical motion are orographic effects, frictional effects, frontal lift, and buoyancy.
12.4.1 Orographic Effects
Winds blowing across mountains and valleys cause the moving air to alternately ascend and descend. If relief is sufficiently great, the resulting expansional cooling and compressional warming of air affects the development and dissipation of clouds and precipitation.
For example, a mountain range that is oriented perpendicular to the prevailing wind flow forms a barrier that results in a cloudier and wetter climate on one side of the range than on the other side (see Figure 12-4). As air is forced to rise along the windward slope, it expands and cools, which increases its relative humidity. With sufficient cooling, clouds and precipitation develop at and above the LCL. Conversely, on the mountain’s leeward slope, air descends and warms, which reduces its relative humidity, and tends to dissipate clouds and precipitation. In this way, mountain ranges induce two contrasting climatic zones: a moist climate on the windward slope and a dry climate on the leeward slope. Dry conditions often extend hundreds of miles to the lee of a prominent mountain range in a region known as the rain shadow.
Figure 12-4. Orographic Effects Example
The air parcel begins with a temperature of 15°C, dewpoint of 10°C, and a relative humidity of 80 percent at 2,000 ft. As the parcel is lifted on the windward slope, the temperature cools at the dry adiabatic lapse rate of 3°C per 1,000 ft, and the dewpoint cools at a rate of 0.5°C per 1,000 ft until it becomes saturated at the LCL at 4,000 ft. Then, the air parcel’s temperature and dewpoint both cool at the moist adiabatic lapse rate of 2°C per 1,000 ft until the parcel reaches the summit at 12,000 ft. At that altitude, the parcel’s temperature is -7°C, the dewpoint is -7°C, and the relative humidity is 100 percent. As the air parcel descends the leeward slope, the temperature increases at a rate of 3°C per 1,000 ft while the dewpoint increases 0.5°C per 1,000 ft. The air parcel ends with a temperature of 23°C, dewpoint of -2°C, and a relative humidity of 33 percent at 2,000 ft, much warmer and drier than at the beginning. Orographic effects are especially apparent from west to east across the Pacific Northwest, where the north–south Cascade Range intercepts the prevailing flow of humid air from the Pacific Ocean. Exceptionally cloudy, rainy weather prevails western slopes, whereas semiarid weather characterizes the eastern slopes and areas farther east.
12.4.2 Frictional Effects
In the Northern Hemisphere, the surface wind spirals clockwise and outward from high pressure, and counterclockwise and inward into low pressure due to frictional force. The end result is that winds diverge away from surface high pressure, causing the air to sink, compress, and warm, which favors the dissipation of clouds and precipitation. Conversely, winds converge into surface low pressure, causing the air to rise, expand, and cool, which favors the formation of clouds and precipitation given sufficient moisture (see Figure 12-5).
Figure 12-5. Frictional Effects
12.4.3 Frontal Lift
Frontal lift (see Figure 12-6) occurs when the cold, denser air wedges under the warm, less dense air, plowing it upward, and/or the warmer air rides up and over the colder air in a process called overrunning. Clouds and precipitation will form given sufficient lift and moisture content of the warm air.
Figure 12-6. Frontal Lift
12.4.4 Buoyancy
Air near the ground can warm at different rates depending on the insular properties of the ground with which it is in contact. A newly plowed field will warm faster than an adjacent lake. These temperature differences result in different densities, allowing the warm air to become buoyant. The denser cool air will tend to push (i.e., lift) the less dense warm air aloft. On a grand scale, the tendency of air to rise due to heating, and how high it will rise, is referred to as stability and is covered in Chapter 13, Atmospheric Stability.
12.5 Cloud Forms
There are four basic cloud forms (appearances) observed in the Earth’s atmosphere (see Table 12-2). See Appendix A, Cloud Types, for cloud types.
Table 12-2. Cloud Forms
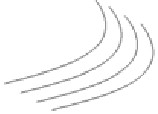 Cirri-form | High-level clouds that form above 20,000 ft (6,000 m) and are usually composed of ice crystals. High-level clouds are typically thin and white in appearance but can create an array of colors when the Sun is low on the horizon. Cirrus generally occur in fair weather and point in the direction of air movement at their elevation. |
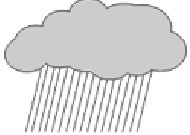 Nimbo-form | Nimbus comes from the Latin word meaning “rain.” These clouds typically form between 7,000 and 15,000 ft (2,100 to 4,600 m) and bring steady precipitation. As the clouds thicken and precipitation begins to fall, the bases of the clouds tend to lower toward the ground. |
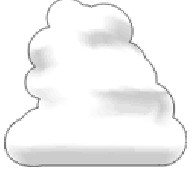 Cumuli-form | Clouds that look like white, fluffy cotton balls or heaps and show the vertical motion or thermal uplift of air taking place in the atmosphere. The level at which condensation and cloud formation begins is indicated by a flat cloud base, and its height will depend upon the humidity of the rising air. The more humid the air, the lower the cloud base. The tops of these clouds can reach over 60,000 ft (18,000 m). |
 Strati-form | Stratus is Latin for “layer” or “blanket.” The clouds consist of a featureless low layer that can cover the entire sky like a blanket, bringing generally gray and dull weather. The cloud bases are usually only a few hundred feet above the ground. When stratus clouds move over hills and mountains, they are able to reach ground level and are thus called fog. Also, as fog lifts off the ground due to daytime heating, the fog forms a layer of low stratus clouds. |
| Source: NWS JetStream – Online School for Weather | |
12.6 Cloud Levels
By convention, the part of the atmosphere in which clouds are usually present has been divided into three levels: high, middle, and low (see Table 12-3). Each level is defined by the range of heights at which the cloud of a certain type occurs most frequently. The levels overlap, and their limits vary with latitude. The approximate heights of the limits are included in Table 12-3.
Table 12-3. Approximate Height of Cloud Bases Above the Surface
| Level | Polar Regions | Temperate Regions | Tropical Regions |
|---|---|---|---|
| High Clouds | 10,000–25,000 ft (3–8 km) | 16,500–40,000 ft (5–13 km) | 20,000–60,000 ft (6–18 km) |
| Middle Clouds | 6,500–13,000 ft (2–4 km) | 6,500–23,000 ft (2–7 km) | 6,500–25,000 ft (2–8 km) |
| Low Clouds | Surface–6,500 ft (0–2 km) | Surface–6,500 ft (0–2 km) | Surface–6,500 ft (0–2 km) |